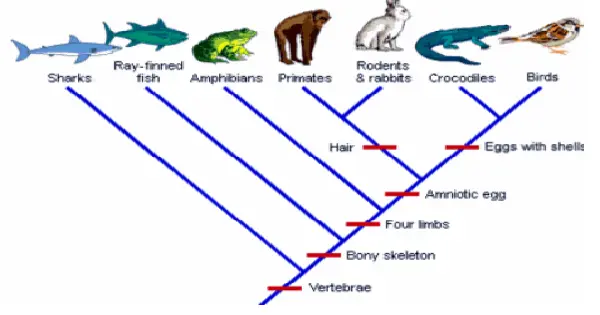
A hypothesis that explains how all biological life on Earth evolved during the past (roughly) 3.8 billion years is the definition of a branching tree diagram. A branching tree diagram illustrates the relationships between each taxonomic group of living and extinct microorganisms, plants, and animals, showing who their ancestors and descendants are. A branching tree diagram resembles a real tree in that its trunk shows the earliest progenitor of all living things, while each branch shows its offspring. The physiological characteristics of organisms that share a branch are likewise shared.
There is no perfect way to create a tree. Every diagramming technique has some drawbacks. On a branch, organisms are not usually arranged consistently or effectively. Evolutionary biologists face a challenging task in tracing the evolutionary history of every known species, given that there are currently 8.7 million distinct species on Earth. Fortunately, the majority of branching tree diagram construction techniques perform admirably in various analytical scenarios.
In scientific studies, branching tree diagrams are used: Since the mid-1800s, branching tree representations have aided discussions of evolution, particularly when Charles Darwin hypothesized how life on Earth developed into a bewildering diversity of many species. However, scientists didn’t make an effort to properly comprehend how branching tree diagrams should be created and evaluated until the middle of the 20th century. Using branching tree diagrams, scientists can now:
- Visually infer links between extinct and current (living) species.
- When examining the possibility of evolution, researchers use this framework to help construct their study questions and research strategy.
- a list of the biological diversity on Earth.
Evolutionary biologists learn more about the physiological and genetic relationships among the members of each taxonomic group through the course of each study endeavor. As a result, the process of phylogeny—the representation of how specific genes are passed from an ancestor to its descendants in a branching, phylogenetic tree—is also known as the study of biological evolution. In order to keep their understanding of Earth’s evolutionary history current, scientists update their visual charts each time they provide a solution to a question about the relationships between various groups of organisms.
Structure of a Branching Tree Diagram: There are two types of branching tree diagrams: rooted and unrooted. A rooted phylogenetic tree demonstrates the shared ancestor of all species. An unrooted phylogenetic tree, on the other hand, ignores the shared ancestry and focuses solely on how different species are related to one another.
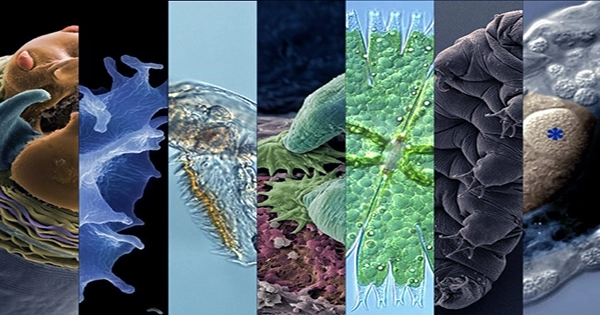
The oldest common ancestor of the descending taxonomic groups is represented by the tree’s trunk in a rooted phylogenetic tree. The original trunk of the phylogenetic tree can be divided into three primary groups, according to recent studies in evolutionary biology. The first division is made up of bacteria, which are single-celled microbes with the most basic cell structure on Earth. The second division of the main trust represents archaea, which are microscopic species related to bacteria but with different forms due to evolution. Eukaryotes, or organisms with membrane-bound organelles in their cells, are represented by the third division of the main trunk. One such organelle is the nucleus, which houses chromosomes storing DNA (each organism’s distinctive genetic code). Animals, plants, fungus, protists, and the majority of algae are all eukaryotes.
Scientists first depict the trunk, then a series of branches that split off from the trunk. The descendants of the common ancestor are shown by each branch. Because of this, the diagram is referred to as a branching tree. In comparison to the following group of descendants, the first set of descending species (or lineages) has a longer branch on the tree. The newest species to have evolved and still exist today are represented by the phylogenetic tree’s shortest branch (or tip). A branching tree graphic demonstrates the relationship between different taxonomic groups of organisms. These nested taxonomic groups are connected by a common set of characteristics.
A node is any location where a new branch begins to develop. The node symbolizes an event known as speciation, which occurs when an organism separates into a new species that is reproductively unique from all other organisms, including its ancestor. The terminal, terminal taxa, or taxa represent the separate species or creature at the extremity of the branch.
Characteristics: The first step in evolutionary biologists’ investigations is to identify derived and primitive features in the target species (or taxa). While derived qualities are the product of a genetic mutation in a more recent ancestor, primitive traits are shared with the extinct common ancestor.
A trait is considered homologous when several species share it with a common ancestor. Each organism’s genes (or DNA) contain the genetic information for all homologous features. The tails of cats, dogs, and monkeys are three examples of homologous traits that can occasionally appear remarkably similar. Sometimes the homologous characteristic is altered to fit the unique requirements of each organism. Think about cacti, poinsettias, pitcher plants, and Venus flytraps. Although the four plants all have distinctive looks, they all have the same homologous characteristic. The pitcher form of pitcher plants, the jaws of Venus flytraps, the needles of cacti, and the red leaves of poinsettias all originated from an ancient plant’s leaf. In fact, while looking at the forearm bones of modern tetrapods, one can observe analogous characteristics. Animals including dolphins, frogs, dogs, birds, mice, humans, and other species share a striking similarity in the radius, ulna, wrist, and hand bones of the forearm.